

You've spent years building your collection. But until now, your dashboard mostly told you what
you have, not what it's worth, where the gaps are, or when something you've been hunting for
finally shows up. We just changed that.
The problem
A collection isn't a static list. Its value drifts, your records have gaps you forget about, and
the one piece you've wanted for years can appear on the marketplace the day you're not looking.
The old dashboard was a snapshot, useful but passive. You had to go digging to answer the
questions that actually matter: What did I pay versus what it's worth? What still needs fixing?
Is anything I want available right now?
What we built
We turned the dashboard into a working surface. It now answers those questions for you the moment
you open it, value, gaps, milestones, and marketplace matches, all in one place, and lets you
slice the view by when you acquired things.
How it works
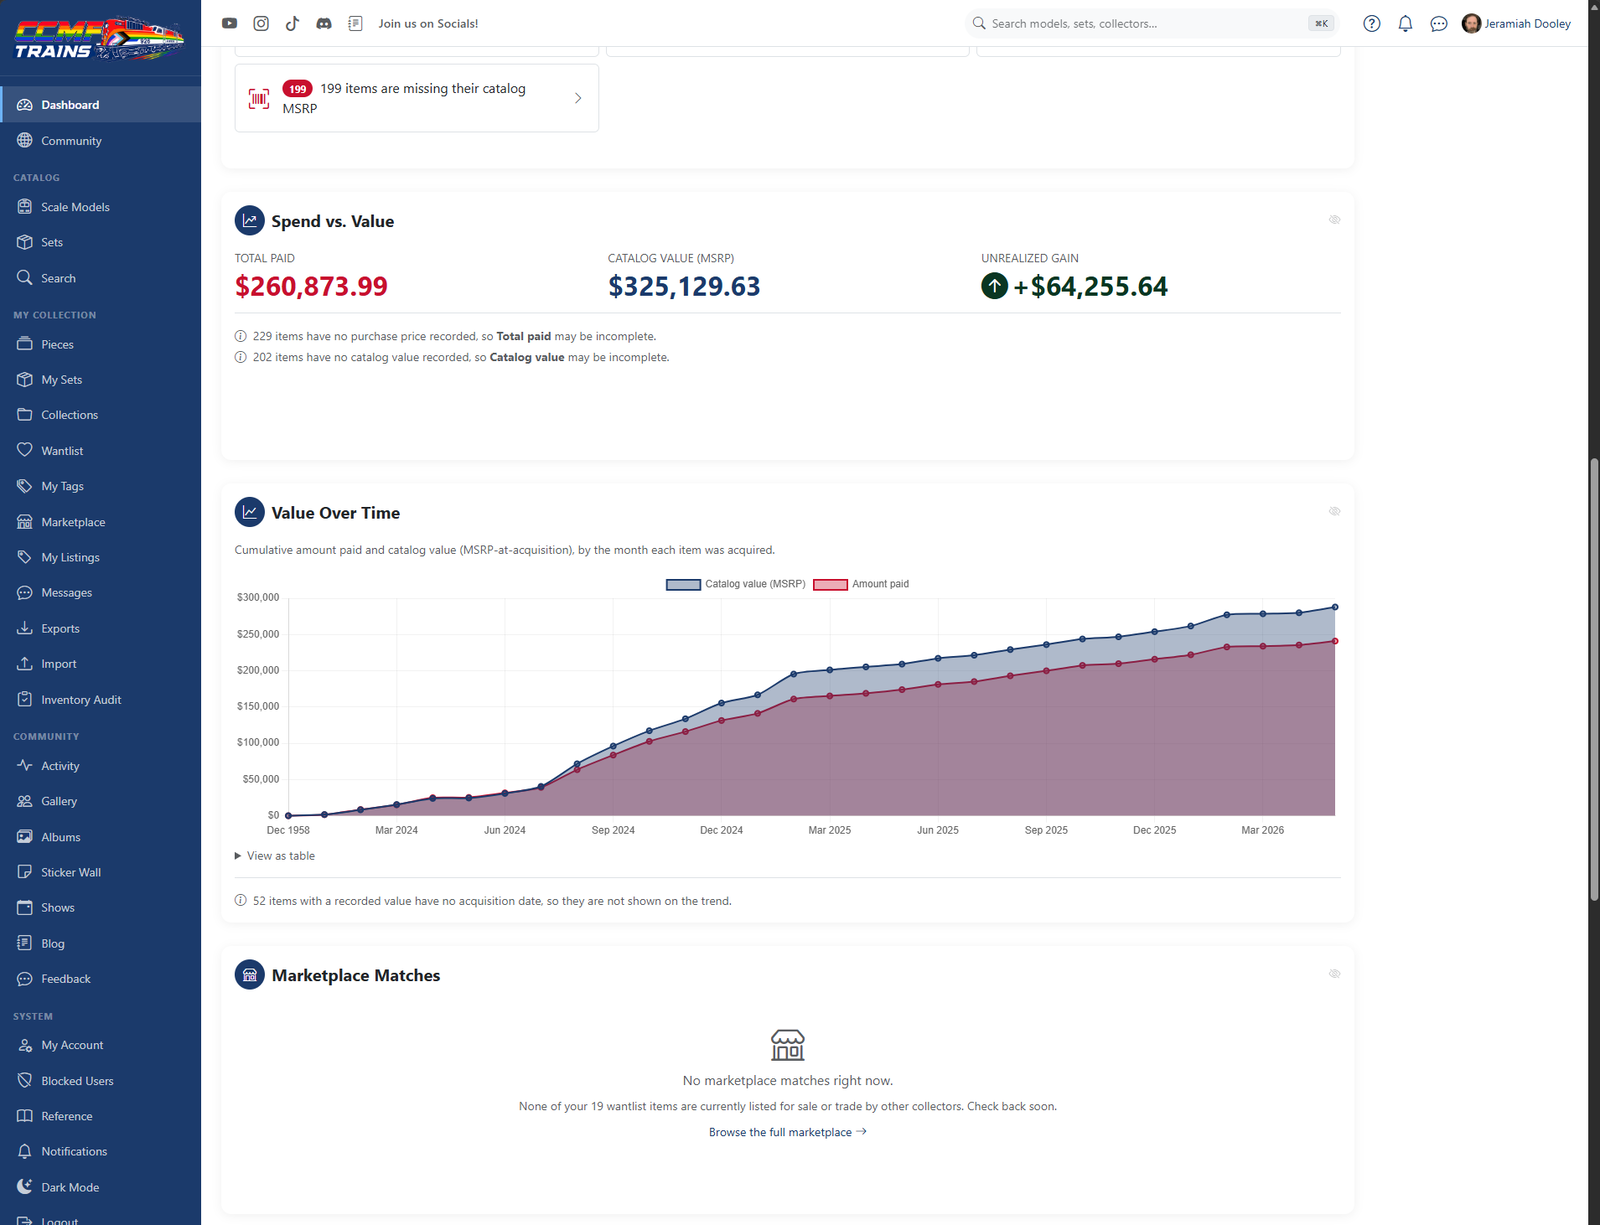
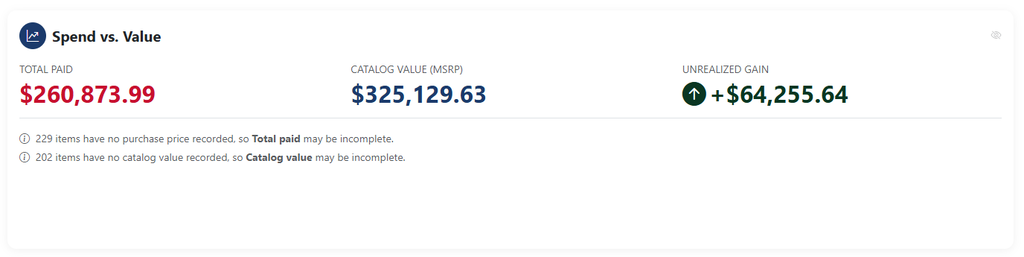
See spend versus value at a glance. The Spend vs. Value card shows three numbers: Total paid, Catalog value (MSRP), and your** unrealized gain or loss**, with a clear up/down arrow and label so the result reads correctly even at a glance..
Watch your collection grow over time. Value Over Time plots cumulative spend against
cumulative catalog value month by month. Prefer numbers to lines? The same figures sit in a
data table right below the chart.Clear the little stuff. Needs Attention gathers quick follow-ups, records missing a
purchase price, a catalog link, or other details, into tiles that take you straight to the fix.
When there's nothing to do, it simply says you're all caught up.Catch your wantlist in the wild. Marketplace Matches watches your wantlist and surfaces
items, both individual pieces and full sets, the moment a fellow collector lists them for
sale or trade.Celebrate the journey. The Milestones card tracks progress toward pieces owned,
manufacturers collected, and time collecting. Cross a milestone and you'll get a notification, in-app always, and by email if you opt in under your notification settings.Focus on any era. Use the Acquisition date filter to scope the value and composition
cards to a range, say, everything you picked up last year. Cards that always reflect your
whole collection stay badged All-time so the picture is never misleading.

What it means for you
This is the difference between owning a collection and understanding it. Prepping for
insurance? The value figures are right there. Thinking about selling? You can see your unrealized
gain before you list. Tidying your records on a quiet evening? Needs Attention hands you a punch
list. And you'll never again miss a wantlist piece because you happened to look the wrong day.
Tips & good to know
- Charts are clickable. Click a slice to jump to that exact slice of your inventory. You can
also switch chart types and save chart setups as presets for views you use often. - Numbers depend on your records. Spend and value figures are only as complete as the purchase
prices and catalog links you've recorded — the dashboard tells you when something's missing. - New here? The welcome dashboard walks you through adding your first piece, building a
wantlist, or exploring the catalog.
Ready to try it? Open your Dashboard. Take a minute to set an acquisition date range and
clear a Needs Attention tile or two — then check the release notes for the
full rundown.